Energy
The so-called energy transition plays a central role in achieving the climate goals. The EU plans to reduce CO2 emissions by 55% (1990) by 20230. Net zero applies for 2050.
These goals are to be achieved by switching from fossil fuels such as coal and gas, and in Germany also from nuclear power, to renewable energies such as wind, solar and biomass. In addition to the enormous costs and time pressure caused by climate change, the issue of security of supply is becoming increasingly important. The grids and other infrastructures must be expanded in a stable and sustainable manner for a successful transition

Volume of redispatch measures FOR RE fell by eleven percent

Published
10/2025 by Team buildData
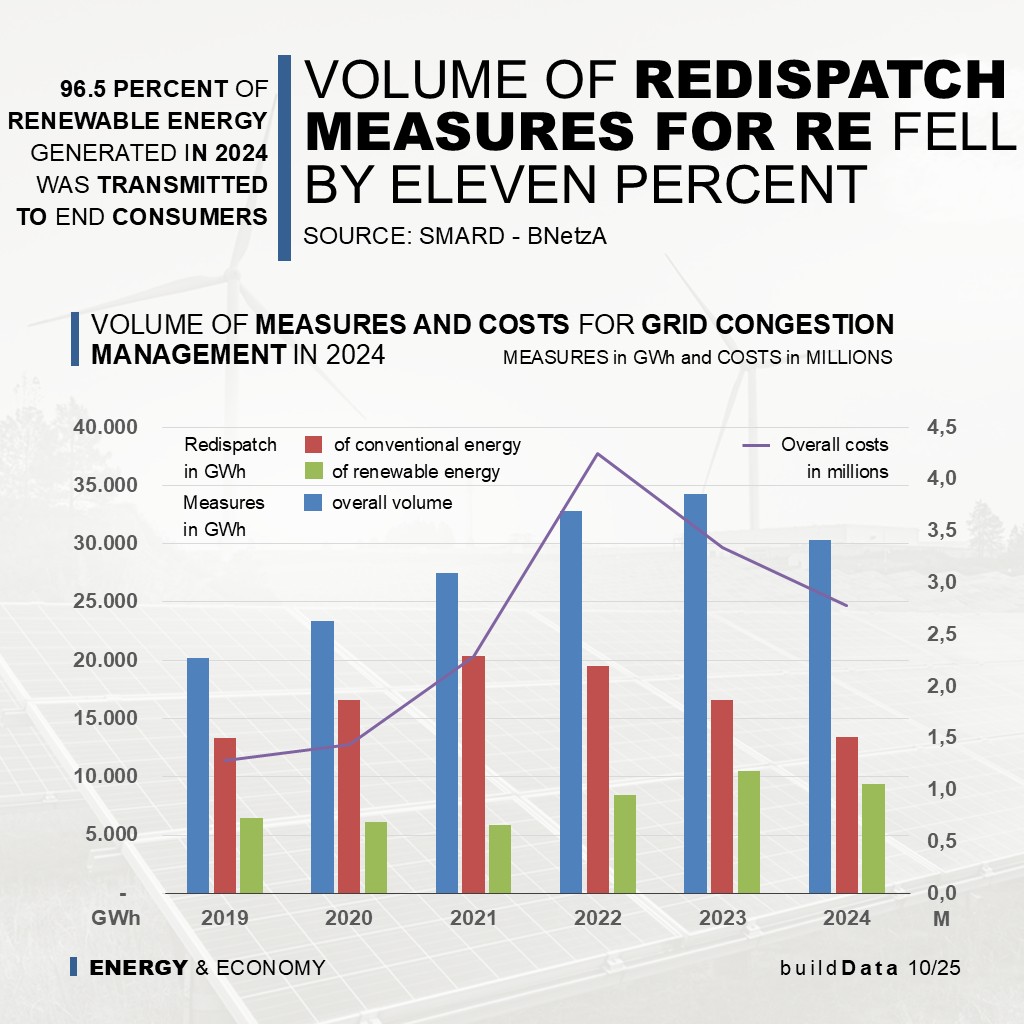
The continuous expansion of renewable energies is progressing faster than the expansion of the electricity grid, which poses major challenges for the overall system. In order to avoid grid overloads and thus ensure grid stability, targeted grid congestion management must be implemented. Read this article to find out how this works and what it costs.
The flow of electricity in Germany is characterised by a strong north-south divide. While numerous offshore and onshore wind turbines generate large amounts of electricity in the north, the majority of production facilities with intensive electricity requirements are located in southern Germany. Because grid expansion takes significantly longer to implement than the construction of new wind and solar power plants, the transmission and distribution grids are becoming bottlenecks. Grid capacities are significantly exceeded during periods of light winds.
This is when so-called grid congestion management comes into play, whereby the feed-in from plants upstream of a bottleneck is reduced and the feed-in from plants downstream of the bottleneck is increased. The aim is to optimise the grid load and ensure a continuous supply.
These measures cost money, which prompts some critics to call for a slowdown in the expansion of renewable energies and to counteract their volatility with conventional power plants in the grid.
Compared to the previous year 2023, the volume of measures and the costs for grid congestion management fell by 12 percent (in GWh) and 17 percent to a total of €2,776 million, respectively. In the fourth quarter of 2024, however, they were significantly higher than in 2023, which is attributable to an increase in redispatch measures with offshore wind turbines (Q4 2023: 1,504 GWh; Q4 2024: 1,812 GWh) and the significant increase in redispatch measures with reserve power plants. One of the reasons for this was a prolonged wind front in December 2024, which led to bottlenecks. In the fourth quarter of 2024, the costs for redispatch measures totalled €928 million, around €44 million higher than in the same period of the previous year.
What are dispatch, redispatch and redispatch 2.0?
The term dispatch refers to the deployment planning of power plants by the power plant operator. The German term for dispatch is ‘Kraftwerkseinsatzplanung’ (power plant deployment planning). The term redispatch, on the other hand, refers to the short-term change in power plant deployment at the behest of the transmission system operators to avoid grid bottlenecks. In other words, when an impending overload of a line section is detected, the grid operators request power plant operators to increase or decrease the feed-in in order to eliminate the grid bottleneck. In October 2021, Redispatch 2.0 came into force in Germany, which also included generation plants and storage facilities from 100 kW and distribution network operators in the redispatch regime.
The renewable energy plants most frequently curtailed in Germany in 2024 were offshore and onshore wind turbines, with a total of 7,946 GWh. Compared to the previous year, curtailment of wind turbines fell by 20 and 15 percent (onshore and offshore, respectively). Solar plants were curtailed by a volume of 1,389 GWh, primarily in southern Germany. This corresponds to around 97 percent more curtailment of solar plants than in the previous year. The reasons for this are the enormous expansion of installed capacity within a year and the exceptionally high solar radiation in the summer of 2024.
Reserve power plants were used to relieve grid bottlenecks with 1,788 GWh. In comparison, the figure for the previous year 2023 was 1,214 GWh, and in 2022 a total of 2,934 GWh.
Despite the bottleneck problem, a total of 96.5 percent of renewable energies were fed into the grid and supplied to end consumers in 2024. In 2024, bottlenecks increasingly shifted to the transmission grids (74 percent), although 47 percent of the curtailed renewable energy power plants are located in the distribution grid.
What is countertrading?
While redispatch is a direct, grid-based measure, countertrading is an indirect, market-based measure to avoid electricity grid bottlenecks. Countertrading influences the load flow through the short-term purchase or sale of electricity by grid operators on the intraday market.
In 2024, the volume of countertrading measures amounted to around 5,739 GWh, a decrease of 5 percent compared to 2023, which is attributable to additional grid expansion.
Operators of renewable energy power plants receive financial compensation for curtailment, which amounted to around £554 million in 2024. In 2023, the figure was around £580 million. This represents a decline of just over 4 percent, while the decline in volume was around 10 percent. The reason for this is the fall in wholesale prices, which means that operators of renewable energy plants are simply missing out on subsidies under the Renewable Energy Sources Act.

RED III (Renewable Energy Directive III) - Considerations on the transport sector
Published
10/2025 by Team buildData
In the RED III (Renewable Energy Directive III, revision of RED II) of November 2023, the targets for the use of renewable energies within the EU were raised to 42.5 percent. In this article, we discuss what RED III means for the transport sector.
EU Member States are still struggling to implement RED III. Among the 27 member states of the European Union, only Denmark had implemented the Renewable Energy Directive III nationally in time. In Germany, the implementation into German law became fully effective on 15 August 2025 with a delay. In Poland, the draft law is expected in the first quarter of 2026.
The target for the transport sector has also been significantly tightened. While the 2018 version of RED II set a minimum share of renewable energies in final energy consumption at 14 percent for the transport sector, the current Renewable Energy Directive III stipulates a minimum share of 29 percent by 2030. An alternative target could be a reduction in greenhouse gases (GHG) of at least 14.5 per cent compared to the emissions that would have been produced by the use of fossil fuels.
The transport sector includes rail and road transport, aviation and shipping.
Electrification of transport will play a key role in raising the share of renewable energies in final energy consumption to 29 percent. In one possible scenario (our illustration), the share amounts to 14.8 percent. This means that a good half of the target is to be met by electric mobility.
The second largest share, a maximum of 7 percent, is to be covered by the use of conventional biofuels, followed by so-called advanced biofuels with 4.5 percent, biofuels and biogas according to Annex IX, Part B, with 1.7 percent, and RFNBOs with a maximum of one percent.
A brief explanation of the terminology:
RFNBOs (Renewable Fuels of Non-Biologic Origin) comprise renewable energy sources that do not originate from biomass or are of non-biological origin. The most important representatives are green electrolysis hydrogen and its derivatives, i.e. ammonia or e-fuels.
Biofuels and biogas according to Annex IX, Part B consist of advanced raw materials such as biomethanol from agricultural waste, biodiesel from used cooking oil (UCO) or advanced bioethanol variants that do not originate from foodstuffs. Annex IX, Part A lists biofuels that do not use direct agricultural land (e.g. not maize or rapeseed), such as algae grown in basins, manure and straw.
Why only 1% RFNBOs as a target for 2030? The targets for the use of hydrogen, for example, are more ambitious, particularly in heavy-duty transport, aviation and maritime transport, but considerable effort, time and investment are needed to create the infrastructure required for production and use. RED III is a first step towards a complete switch to renewable fuels and widespread use of hydrogen. Due to the enormous challenges involved in individual fuel applications, RED III (2030) deliberately focuses on various renewable fuels.
As mentioned above, the electrification of transport currently plays a key role. This refers to fully renewable electricity generated from sources such as hydropower, wind, solar or geothermal energy. Electricity procurement criteria must be taken into account here.
You need more information? We have linked the current version of the Renewable Energy Directive III and the NOW fact sheet below.

Greater political influence through alliances
Published
09/2025 by Team buildData
Should the associations representing interests in the renewable energy sector continue to pool their resources and activities? Currently, the pendulum of energy policy in Germany and Poland is swinging back towards gas and nuclear energy. When we talk to young people on the streets these days, they are more interested in discussing these topics than solar, wind and battery storage. So what’s going on?
Issues such as grid stability and the volatility of solar and wind energy sources repeatedly put renewable energies under pressure in the debate on the energy transition. Some see the solution in the use of energy storage systems and smart grids, while others favour the construction of gas or nuclear power plants.
The fact is that, whether in Germany or Poland, politicians in both countries are currently only giving renewable energies limited free play and are putting the brakes on them.
There are arguments, for example in Germany, against relying on gas-fired power stations, but instead ...?
The chain of arguments is long and varied. As varied as the generation of electricity from the various renewable energy sources.
But who is presenting the master plan for promoting renewables, which is supported by the European Union's clear climate protection targets?
Anyone who looks around on social media will quickly recognise the wild confusion in the arguments. And the associations? As part of their lobbying work, they are endeavouring to provide technical information and to sort through all the interests and argumentation strategies.
It seems to us that forces need to be joined once again to convince even the last holdouts of the energy transition as we understand it: renewable.
The renewable energy associations now have a clear bargaining chip in their hands: renewable energies are indispensable, and in the long term, they are most cost-effective.
In order to finalise the law on the promotion of renewable energies in Poland and to avoid fossil fuel missteps in the energy transition in Germany, it is probably necessary to join forces, including within the associations.
This should also be possible, as in the countries with the highest rates of renewable energy expansion to date, the associations of the individual sectors have joined together to form umbrella organisations. In Germany, this is the Bundesverband der Erneuerbaren Energien e.V. (BEE), in Denmark the interest group Green Power Denmark and in France the association France Renouvelables.
The latter emerged on 19 September 2023 (exactly two years ago today) from the Association France Energie Eolienne. The statement at the time, ‘L'association France Energie Eolienne devient France Renouvelables’, explains the why and wherefore, which has lost none of its relevance and necessity to this day:
In order to accelerate the energy transition, France Renouvelables ‘is convinced that a systemic vision for the use of renewable energies, storage, flexibility and the economic and regulatory framework is needed today,’ explains the association, which voted ‘92%’ in favour of this change of status on Tuesday (2023). ‘The climatic, social and economic context forces us to look at the system as a whole and in an integrated way, and no longer at each of its components separately,’ explains the association's chairwoman, Anne-Catherine de Tourtier. ‘In order to both solve our energy supply crisis and decarbonise our consumption and protect the purchasing power of the French people, it is obvious that the players involved can no longer work as they have done in the past.’
To avoid any misunderstanding, this is by no means intended to be a swan song for technology-isolated interest groups. Rather, this article is intended to call for the promotion of cross-technology cooperation between associations and to give the umbrella organisations, some of which are still very young, more dominance. The network meeting of networks, which took place for the first time this week at Husum Wind 2025, is a good step towards ‘Working together for the energy transition’.
And we must join and FOLLOW.
- Bundesverband Windenergie e.V.
- Bundesverband Erneuerbare Energien e.V.
- France Renouvelables
- Renewable UK
- Green Power Denmakr
- Nederlandse Wind Energie Associatie
- Polskie Stowarzyszenie Energetyki Wiatrowej
- Asociacion Empresarial Eolica
- Associazione Nazionale Energia del Vento
- Sensk Vindenergi / Swedish Wind Energy Association
- Romanian Wind Energy Assosiation

The electricity grid in the EU and UK - stability required
Published
09/2025 by Team buildData
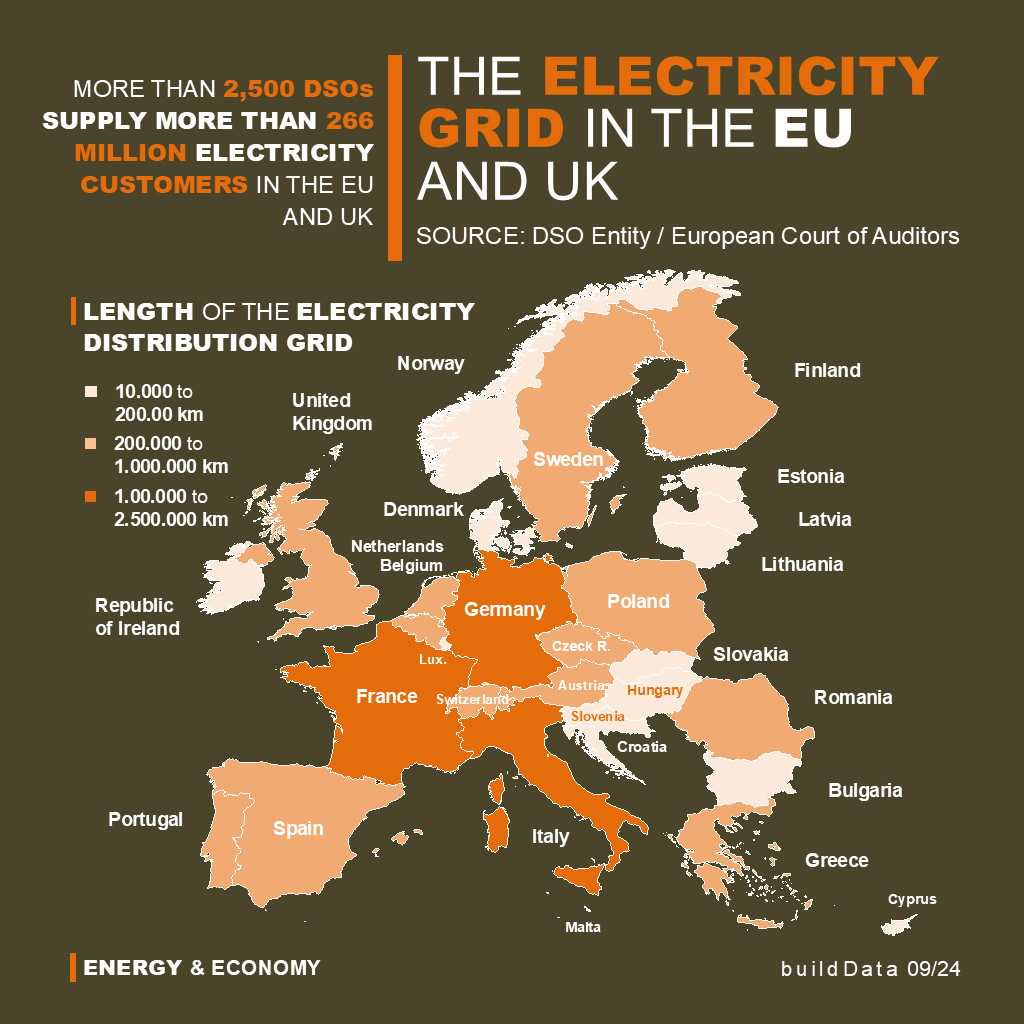
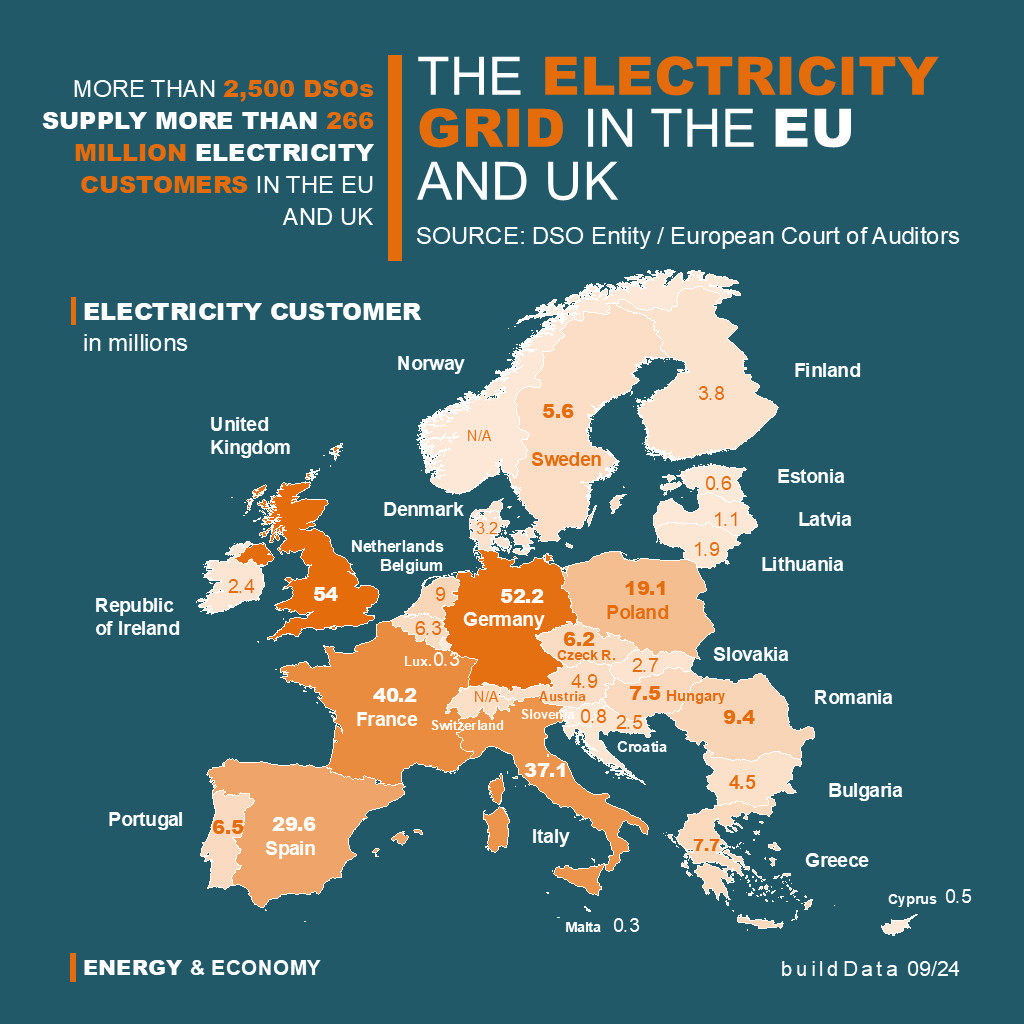
The electricity grid is the most complex and widespread infrastructure in the world. We take it for granted that electricity is available from the socket at all times, evenly and in full. Ensuring that this remains the case even in times of energy transition within the EU is a major challenge and a billion-euro investment for the 2,500 DSOs and 30 TSOs.
The electricity grid within the European Union is over 11.5 million kilometres long (282 times around the earth) and supplies over 266 million customers (households and businesses) in 27 countries and EU regions. It connects large cities with the most remote regions and is probably the most important basis for economic power and prosperity for people. Without electricity, nothing works today.
With the European Union's decision to achieve climate neutrality, i.e. net zero greenhouse gas emissions, in the EU by 2050, the electricity grid is under enormous pressure. This is because, with the energy transition to net zero, the share of electricity from renewable energy sources such as solar and wind is steadily increasing. By 2030, 45% of energy consumption is to be generated from renewable energies. Wind and solar energy (the main components of the renewable energy mix) are so-called fluctuating or volatile energy sources because their energy production is heavily dependent on the availability of natural conditions such as time of day, season and weather conditions.
The volatility of these energy sources contrasts with a highly sensitive and complex transmission and distribution network, which is designed to provide end customers with a constant and stable supply of electricity at all times. Electricity is a transient resource. It must therefore be consumed or stored as soon as it is generated. This means that grid operators must constantly strike a perfect balance between supply and demand.
This is a complex task in itself, and in the past, stable energy sources such as coal and nuclear power plants acted as stabilisers.
In short, the existing electricity grid infrastructure is designed for stable, non-volatile energy sources and must be repaired, expanded, modernised and equipped with new innovative technologies for a net-zero future.
The Commission estimates that between €1,994 billion and €2,294 billion will need to be invested between 2024 and 2050 to get the EU electricity grid fit for purpose and keep it running. These figures are forecasts and difficult to pin down more precisely, especially as the electricity market is subject to dynamic trends.
It is currently assumed that the share of electricity in final energy consumption within the EU will increase 2.5-fold from 23 percent to around 57 percent (2050) and that the share of renewable energies will increase 2.2-fold from the current 42 percent to around 90 percent by 2040. The share of electric passenger cars within the EU will be around 17 percent in 2030, around 58 percent in 2040 and around 80 percent in 2050 (factor 46). The volume of large-scale battery storage will increase from around 0.6 GW at present to around 200 GW (a factor of 333).
However, these developments are not evenly distributed across the EU's electricity grid. There are already major differences in the pace of development because the basic conditions and framework conditions vary from country to country. A simple example of this is the introduction of so-called smart meters. While in Scandinavian countries such as Denmark, Sweden and Finland, but also in Italy, for example, every electricity customer has a smart meter (100 percent), only 27 percent of customers in Poland and less than one percent in Germany have one.
To better understand the complex transformation of the European electricity grid, it is advisable to first familiarise yourself with the basic data and then analyse the trends and forecasts. A good basic read is Analysis 01 by the European Court of Auditors entitled ‘Making the EU electricity grid fit for net-zero emissions’ (2025), which is available in English and German and can be easily found in the links below.

What do CO2 equivalent and global warming potential mean?
Published
05/2025 by Team buildData
In this article, we explain in simple terms what a CO2 equivalent is, which greenhouse gases have what global warming potential, and what a carbon footprint is good for.
The e in CO2e stands for equivalent. But let's first clarify what we mean by equivalence: Equivalence is a relationship between two statements that are not identical in content but have something in common, such as being true or false.
In relation to climate change, greenhouse gases all have the ‘true’ commonality of having a negative impact on global warming. However, they do so with varying intensity.
In order to compare the intensity of greenhouse gases and quantify and evaluate emissions from a cocktail of greenhouse gases, they have been converted into CO2 equivalents (CO2e) using the Global Warming Potential (GWP). The GWP standardises the effect of all greenhouse gases to the effect of CO2, which is probably the best known greenhouse gas as it is the one most emitted by humans.
According to the Kyoto Protocol and the Greenhouse Gas Protocol of the IPCC (Intergovernmental Panel on Climate Change), the following greenhouse gases are included: carbon dioxide (CO2), methane (CH4), nitrous oxide (N2O) and fluorinated greenhouse gases. F-gases are hydrofluorocarbons (HFCs), perfluorocarbons (PFCs) and sulphur hexafluoride (SF6). Nitrogen trifluoride (NF3) was added to the list around 10 years ago.
Carbon dioxide (CO2) has a GWP value of 1, while methane is approximately 27 times more potent than CO2 per kilogram and therefore has a GWP of 27 CO2e. If 1 kg of CO2 is released together with 1 kg of methane, this results in total emissions of 28 kg of CO2 equivalents. All GWP values can be found in the link below.
What is the purpose of the conversion? We, as well as companies, are interested in knowing how much emissions are generated in which processes and what can be done to reduce them to net zero wherever possible. This allows us to determine a carbon footprint, a balance sheet that expresses how sustainable a company is. Companies in the EU that meet certain size criteria are now required to publish a CO2 balance sheet in a sustainability report on a regular basis. For environmentally conscious consumers, the CO2 balance sheet then serves as a guide or advisor when choosing products.
Did you know? – Together towards net zero!

Energy supply from renewable energy in 2024
Published
04/2025 by Team buildData
The energy transition in Germany is progressing. Nevertheless, the expansion of renewable energies must proceed at a significantly faster pace until 2030 in order to meet the EU climate targets. The share of renewable energy sources in Germany’s gross final energy consumption must be nearly doubled from 22.4 to 41 percent.
In 2024, 517 terawatt hours (TWh = billion kWh) were generated from renewable energy sources in Germany. Electricity production accounted for 55 percent, the heating sector for around 38 per cent and fuels (mobility) for approximately 6 percent.
However, there is still a lot to be done in the coming years. The ambitious EU climate targets for 2030 set the tone. How can the share of renewable energy sources be doubled?
The heating and transport sectors must be significantly expanded in the future!
But these last two areas have been slow to grow in recent years. While the share of renewable energy sources in gross electricity consumption has almost doubled to 54.4 percent, the shares from the heating (18.1 percent) and transport (7.2 percent) sectors have stagnated.
Biomass remains the most important energy source. This is due to its flexible uses as a solid fuel, as gas for electricity generation or as a fuel for mobility. Biomass covers around 47 percent of renewable energy supply. It is followed by wind energy with around 27 percent, solar energy in photovoltaics and solar thermal energy with 16 percent, and the remaining 10 per cent from hydropower, geothermal energy and environmental heat.
The wind power sector benefited from good weather conditions in 2024. In addition to more wind than in previous years, there were also more hours of sunshine, which had a positive impact on solar energy.
In 2024, wind energy provided approximately 138.9 TWh of electricity. 74.1 TWh came from photovoltaics, 48.6 TWh from biomass and 22.2 TWh from hydropower. In the smaller heating sector, around 159.1 TWh (31%) was generated from biomass and around 38.1 TWh from geothermal and solar thermal energy. Biofuels for transport accounted for 32.7 TWh.
The use of geothermal and environmental heat via heat pump technology is playing an increasingly important role in the development of renewable heat. The share from wood combustion has been pushed back to pre-gas crisis levels.
Renewable energies account for the lowest share in the transport sector. In 2024, it amounted to around 7.2 percent and mainly consisted of electricity for rail and road transport. There was a decline in the sale of biofuels. Due to a change in legislation in autumn 2024, a significant increase in biofuels in the transport sector is expected between 2025 and 2027.
An increase in renewable energies is leading to a displacement of fossil fuels, thereby avoiding greenhouse gas emissions. In 2024, the use of renewable energies in Germany avoided climate-damaging greenhouse gas emissions of around 256 million tonnes of CO2 equivalents.

generation OF RENEWABLE ENERGY GROWs also in 2024
Published
01/2025 by Team buildData
In 2024, Germany generated around 59 percent of its total energy production from renewable sources. Overall, around 4.2 percent less electricity was generated than in 2023 (431.7 TWh). In 2024, Germany remains a net electricity importer with 31.9 TWh. On average, the electricity price was 9.9 percent higher than in neighboring countries. It was therefore cheaper to import electricity than to generate it domestically.
The average wholesale electricity price in the day-ahead market last year was €78.51/MWh, down around 17.5 percent on 2023. In France and Denmark, average wholesale electricity prices were €58.02/MWh (France) and €70.75/MWh (Denmark), and thus below German wholesale prices. Germany imported a total of 67.0 TWh of electricity, an increase of 23.2 percent. The main supplier was France.
Exports of electricity from Germany fell by 10.1 percent to 35.1 TWh in 2024. The largest customers were Austria with 9.2 TWh (2023: 8.5 TWh) and Poland.
Onshore wind energy remains the driving force behind the expansion of renewable energies. Onshore wind energy accounted for around 25.9 percent of total generation. The largest increase was recorded by photovoltaics, with a total of 63.3 TWh (2024). In 2023, 55.7 TWh was fed in from solar energy.
In our graphic, we have compared the data currently published by SMART for 2024 with the data for total generation in 2021, a year in which nuclear power still accounted for more than 10 percent of total energy generation in Germany and the share of electricity generation from fossil fuels was still more than 57 percent.
Between 2021 and today (2024), Germany phased out nuclear power. 2022 was the last year in which the last reactors still supplied electricity as planned and accounted for around 6.7 percent of total energy production. In 2023, the share was still around 1.5 percent until the final shutdown of all reactors in April of that year. Thus, 2024 was the first year in Germany without any energy generation from nuclear power. Three years ago, the share was still 12.9 percent.
At the same time, the share of natural gas and lignite in total energy production was also reduced by around 3 percent each. Hard coal by 4 percent. Offshore wind energy did not achieve any significant growth. Its share in 2024 was 6 percent. Biomass remained almost at the 2021 level, rising by only 0.5 percent.
Electricity consumption (grid load, excluding private consumption by private systems) in Germany rose by 1.3 percent year-on-year to 464.4 TWh in 2024. Three years ago, in 2021, it was still 504.5 TWh, or around 8 percent more.
The further development of the electricity market in Germany remains exciting, also in view of the new elections at the end of February 2025. It also remains to be seen what influence the construction of large-scale battery storage systems will have and how the hunger of the large-scale data storage required in the context of digitalization and the AI age can be satisfied

Renewable energy accounted for more than 61.5 percent of total energy mix
Published
12/2024 by Team buildData
The mid-year results for 2024 for electricity generation in Germany are positive for renewable energies. Their share in the first 6 months is around 61.5 percent of total electricity generation. The share of wind energy rose from 28 to around 33 percent compared to the first half of 2023. The figures for the third quarter of 2024 are now also available.
In the first half of 2024, renewable energies continue to increase their share of electricity generation in Germany, reaching a new record high and contributing around 61.5 percent of electricity generation. Including the third quarter of 2024, the share amounts to around 56 percent of electricity consumption and is based mainly on the generation of electricity from solar and wind energy, biomass and hydropower. It is around 3 percentage points higher than in the previous year, 2023. According to the latest evaluations, gross electricity generation from renewables increased by 8.3 percent to 217 billion kilowatt hours.
Although the electricity mix in Germany in 2024 consists mainly of renewable energies in every month, at around 53 to 59 percent, it cannot manage without fossil fuels such as coal and gas. However, the share of coal and gas fell significantly by around 10.5 percent compared to the same nine-month period of the previous year. Gross electricity generation from these two conventional energy sources fell to 149 billion kilowatt hours.
Despite the successes in the expansion of renewable energies, Germany is falling short of its potential. The inadequate nationwide expansion of the power distribution grid is quickly identified as a bottleneck for the further expansion of renewable energies. In addition, electricity storage capacities are urgently needed for grid stability. Wind and sun are volatile and, by their very nature, are not constantly available for energy generation.
The expansion of the electricity grids is not keeping pace with the expansion of renewable energies. Compared to other countries such as Denmark and Norway, Germany needs to better coordinate the measures. In Denmark and Norway, the expansion is progressing at a rapid pace, so that according to experts, the energy supply in these countries could be completely independent of fossil fuels as early as 2029.
In Great Britain, the overall situation is more similar to that in Germany. However, the expansion of the electricity grids is even further behind. It is not without reason that the new government recently announced a detailed 10-year strategy for developing the necessary infrastructure. In terms of grid stability, the British are one step ahead with BESS projects. The storage capacity is above the EU average. Again, this is due to the fact that the outdated network is groaning under the strain.
However, it should be noted that although these states have the same goal of getting by without fossil fuels as soon as possible, they have different political, economic and, for example, geological conditions. But even with favorable starting points, such as those Norway has created for itself, it remains to be seen whether the energy transition will actually be completed in around five years, as the oil lobby is also fighting for its future.
But it is not only the oil lobby that is fighting for its market share. Nuclear energy is also repeatedly coming into the focus of strategic considerations. While Germany has completed its nuclear phase-out for the time being, the UK is building two large reactors, Hinkley Point C, and Romania has planned the construction of mini-reactors in its energy strategy, which was made public on November 21, 2024, and has also reintroduced domestic uranium mining into its considerations.

What is PtX?
Published
11/2024 by Team buildData
The world is full of abbreviated terms. – Who hasn’t been there? In lectures and conversations, the person sitting across from us throws around abbreviations. We nod our heads and don’t want to interrupt the conversation or ask in a large group what is behind the individual abbreviation in detail. We assume that everyone else knows what it means. But we couldn’t be more wrong. As a rule, many people in the group don’t know either. So it’s time to clarify important terms. Today: What is PtX?
Admittedly, we have exaggerated a little. PtX should correctly be abbreviated as Power-to-X. The term was established in the 2010s in scientific and technical contexts as part of efforts to efficiently store surplus electricity production from renewable energies (primarily wind and solar) or to convert it into other usable forms of energy.
Power-to-X thus encompasses a range of processes with the aim of making surplus electricity usable, in particular for industrial and economic sectors that will not be able to manage without fossil fuels in the foreseeable future or that cannot currently be easily converted to climate-friendly energies. Power-to-X is therefore a fundamentally important building block for achieving net zero by 2050 in accordance with the Paris Agreement of December 12, 2015.
While Power thus describes the electricity generated from renewable energies, the X optionally stands for gas, such as methane, liquid fuels such as diesel, gasoline or kerosene, or solid synthetic substances.
But how does the process work in which electricity is converted into other usable forms of energy, and which is described by the term power-to-x with the to?
The keyword is hydrogen. To obtain hydrogen from water, electricity from renewable energies is needed. Carbon dioxide is then added to this to produce a gas or liquid fuel from the hydrogen, which can then be used in land, sea or air transport, for example.
For Power-to-X processes to be sustainable, climate-friendly and environmentally friendly, the procurement of the building blocks of water and carbon dioxide must also be considered. As a basic product, hydrogen needs water, which is already a scarce resource in some regions of the world. Ideally, therefore, the water should be drawn from regions without water shortages or from the desalination of seawater. Carbon dioxide can be obtained from the air or from sustainable biomass, so that no additional CO2 is released into the atmosphere during the Power-to-X process.
Further brief explanations in connection with Power-to-X:
Power-to-Gas (PtG) – This process converts electrical energy into gas, such as hydrogen or methane.
Power-to-Liquid (PtL) – Production of liquid fuels, like methanol or synthetic gasoline. In this process hydrogen and CO2 are converted into liquid energy carriers.
Power-to-Heat (PtH) – Conversion of electrical energy into heat, which can be used directly in district heating systems and in industrial processes.
Power-to-Chemicals (PtC) – Many scientists repeatedly emphasize the importance of PtC for the chemical industry. The main products are methanol and ammonia.

16 million jobs in the renewable energy sector
Published
10/2024 by Team buildData
Worldwide, employment in the renewable energy sector will increase by 2.5 million between 2022 and 2023, from 13.7 million (2022) to 16.2 million (2023). This is almost entirely due to the boom in the photovoltaic technology sector.
The 11th edition of the publication series “Renewable Energy and Jobs” by the International Renewable Energy Agency, or IRENA for short, has been available for a few days. The Annual Review 2024 shows a new record of 16.2 million people employed in the renewable energy sector worldwide. Overall, employment rose sharply by a further 2.5 million within a year (previous year's figure: 13.7 million).
The reason is easy to see. The photovoltaic industry is booming and employed 7.11 million people in 2023, 2.21 million more than in 2022. The bioenergy technology sector also saw a slight increase, with around 300,000 more employees. This is mainly due to the liquid biofuels sector, which will employ a total of 2.8 million people in 2023. The biomass and biogas sectors will employ 756,000 and 316,000 people respectively.
The hydropower sector lost around 200,000 jobs in 2023. There were no changes in the wind energy and solar (cooling and heating) technology sectors. Around 1.46 million people are employed in the wind energy sector worldwide, and around 700,000 in the solar (heating/cooling) sector.
In the booming photovoltaic industry, almost 4.6 million people (65%) are employed in the Chinese labor market, followed by India with just over 300,000 employees.
China also leads the TOP 10 country ranking in the field of wind energy, with 51% of employees. Not so in the field of liquid biofuels. Here, Brazil leads the ranking with around 1 million employees. Followed by Indonesia with around 800,000 employees.
Nevertheless, as our graphic shows, China dominates the renewable energy sector with a total of 7.4 million employees, followed, but clearly distanced, by the EU27 countries with 1.8 million, Brazil with a total of 1.56 million and the USA and India with around 1 million employees each.
In 2013, the global renewable energy sector employed around 8.5 million people. In 2023, 10 years later, the figure will be almost twice as high, at 16.2 million.
In contrast, the production value of 473 gigawatts of newly installed electrical capacity in 2023 and a cumulative total capacity of 3865 gigawatts. In 2013, the cumulative total capacity was still around 1600 GW. The technology areas of wind energy and solar photovoltaics were responsible for the rapid increase. The hydropower sector has provided a baseline of around 1000 to 1300 GW since IRENA began its evaluations (2010).
China's increasingly dominant role in the field of renewable energies is also reflected in the global comparison of investment volume. Between 2014 and 2023, China alone invested USD 1572 billion, around three times as much as the United States (USD 550 billion) and around twice as much as the European countries, which invested around USD 785 billion.

Repowering Europe

Published
05/2024 by Thomas Hartwig
In 2023, around 736 megawatts of onshore wind energy were decommissioned in Germany, but at the same time 1,500 megawatts of repowering capacity were connected to the grid.
Repowering is the tuning of wind energy projects. By renewing existing projects, wind energy is used much more efficiently. Older turbines are replaced by modern and more powerful ones. In this way, more electricity is generated on the same area with fewer turbines.
This is all made possible by the research of recent years. Compared to the early days of wind energy in the 1980s, wind turbines in Germany are now being built with hub heights of up to 169 m instead of 30 m, for example. Wind turbines in 2024 are up to 600 times more efficient.
Most wind turbines in Germany are located in Schleswig-Holstein between the coasts of the North and Baltic Seas. The repowering rate here was already 25 percent in 2015. The increase in efficiency thanks to modern turbine technology often makes repowering attractive even before the planned service life of the existing turbines has expired.
While repowering has progressed at a rather low level in Germany since 2018, the all-time high of 1,148 MW from 2014 was narrowly missed in 2023 with a replaced capacity of 1,076 megawatts.
WindEurope estimates that around 27 gigawatts of wind energy capacity will be dismantled by 2030. Around 16 gigawatts of this is to be repowered. 11 gigawatts will be decommissioned. The total capacity will be increased to 28 gigawatts.
In order to achieve the climate targets, around 33 gigawatts of wind energy must be added each year in Europe. An expansion of wind energy of around 29 gigawatts per year is currently considered realistic. This would mean a total of 174 gigawatts of wind energy by the beginning of 2030.

Energy Transition 2023
Published
11/2023 by Thomas Hartwig
ETI-framwork is improved for better decision-making (ETI – Energy Transition Index).
The world hasn't gotten any easier for strategists and thought leaders, either. The Covid crisis, Russia's war on Ukraine, the related global energy economic crisis, and now the flare-up of the Middle East conflict. Issues that blur the continued urgent focus on #climate change?
Extreme weather events, the melting of glaciers and polar ice masses, and severe droughts have changed the awareness of society and politics. The energy transition is anchored as a goal and continues to progress globally.
A look at global #investment in the energy sector makes this clear. Within a decade, the investment volume in renewable energies has overtaken that in fossil energies. A look at the energy transition Index also shows that global activities have increased by 10 percent in the last decade, by only 6 percent in the area of system performance, but by 19 percent in the area of transition readiness.
Looking at the ETI ranking, Nordic countries such as Sweden, Finland, Norway and Denmark retain their top positions. They have made the most progress in terms of system performance and transition readiness. Germany, in 11th place in the ETI ranking, narrowly misses out on a top 10 position. France, on the other hand, manages this with 7th place. However, these countries account for only 2% of energy-related #CO2 emissions, 4% of total energy supply and 2% of the world's population.
China, the world's largest energy consumer, has stepped up its energy transition efforts by 48% in the last 10 years, twice the global average. In terms of so-called transition momentum, #India is one of the few countries that is making progress in all areas.
We have included the #UK in our chart. Reason: While the UK Government's current approach to net zero seems to be losing clarity, we want to better support our UK clients, and underline our commitment to the United Kingdom, by establishing HCE UK.
Nigeria is in the spotlight these days, as the German government is currently in Nigeria for talks. Therefore, we decided to include the ET status of Nigeria.
Interested in the topic. You can find more information here: world economic forum or directly in the Insight Report 2023.

80 percent green energy in 2030
Published
03/2023 by Thomas Hartwig
Quick reminder of where we are right now!
Last week, calendar week 13, we achieved a total of 63 percent net electricity generation from renewable energies in Germany. This is about 2 percentage points more than in the previous week.
At 32.7 percent, net electricity generation from onshore wind is clearly ahead of generation from lignite (13.7 percent, rank 2).
Together with the share from offshore wind (6.6 percent, rank 7), wind energy (onshore and offshore, 39.3 percent) even exceeds the total share from conventional energy generation (lignite and hard coal, gas, nuclear energy, 37 percent in total).
In the first three months of 2022, the share of renewable energies averaged 50.7 percent, and in March 2022 it was 43 percent.
By 2030, the German government plans to draw 80 percent of its energy supply from renewables, while at the same time significantly increasing electricity demand. In 2022, electricity consumption was around 485 TWh. In 2030, it is expected to be over 780 TWh.
So there is still much to be done in terms of the energy transition.

Smart Homes / Save Energy
Published
02/2023 by Thomas Hartwig
Smart homes are no longer a rarity. Many who are planning their new home or want to update their familiar home have their focus on the new technologies.
For users, the technification of the home does not only mean comforts, such as starting the sauna via app on the way back to home , starting the vacuum robot or simply a fast internet.
No, smart homes can save a lot of energy and money in the long run. The use of smart heating and cooling systems brings energy savings of around 50%.
Understandably, smart homes are becoming increasingly popular because of their benefits and conveniences. In the US, there were approximately 57.4 million households using smart technologies at least once a month in 2022. In Europe, there were around 44 million households in 2022, with a jump to over 97 million households predicted by 2025. In Germany, more than 27.5 million households are expected to be smartly equipped by 2026.
An important driver for this development is the expansion of the fibre-optic network. 8.5 million German households were connected to the fibre optic network in 2021. At the end of 2021, two-thirds of German households had a fibre-optic connection available. And the trend is rising. Supply is increasingly concentrated in rural areas.
Compared to the copper-based network, the fibre-optic network promises 17 times less power consumption.
The advantages of the Smart Home cannot be used carelessly. Caution is advised in the choice of technology. More than 40 percent of smart homes use an end device that is susceptible to cyber attacks, which in the worst case can shut down the entire household.

Energy Generation 2022
Published
01/2023 by Thomas Hartwig
This week (02.01.2023), the German Federal Network Agency (Bundesnetzagentur) published current information and figures on the electricity market in 2022.
According to this, electricity consumption fell by around 4% compared to the previous year 2021. This may be due on the one hand to the rather mild winter until the turn of the year and on the other hand, in view of Russia's war of aggression in Ukraine and the associated turbulence in the energy market, to the more conscious saving behaviour of the German population.
Generation from conventional energies fell by around -5.7 percent compared to the previous year, while generation from renewable energies rose significantly by +8.5* percent. There was a particular increase of around 18.7 percent in renewable energies in the photovoltaic sector, not only due to the favourable weather conditions, but also due to the addition of +4.4 GW of plants to a total of 57.7 GW.
Wind power generation was also higher than in the previous year. Onshore generation increased by +12.4 percent and offshore generation by +2.9 percent.
For the coming years, the federal government plans a significant expansion of electricity generation from onshore wind turbines by +10 GW/year. However, this plan is stalling due to a lack of and extensive complaints about permits. The measures and plans of the so-called Easter Package have so far come to nothing.
Generation from nuclear energy decreased significantly, resulting from the shutdown of individual nuclear power plants at the end of 2021. Overall, the share of total generation fell by -49.8 percent. In contrast, generation by gas-fired power plants increased by +1.7 percent despite the lack of gas deliveries from Russia. This is attributed to the high operational flexibility of the power plants. Compared to coal-fired and nuclear power plants, they are far less cumbersome to manage in ramping up and down.
The return of coal-fired power plants to the electricity market by the federal government in response to wholesale gas prices increased generation by +5.4 percent from lignite and +21.4 percent from hard coal.
The average wholesale electricity price rose by +140.4 per cent in 2022 compared to the previous year to 232.85 euros/MWh
For more information on the electricity market in 2022, see SMARD | Der Strommarkt im Jahr 2022.
*Note: The significant increase of +8.5 percent in generation from renewable energies refers to the so-called grid load and not to gross electricity consumption. The grid load does not include power plants' own consumption or industrial grids, so that the calculation basis used tends to result in a higher share of renewable energies compared to the share of gross electricity consumption.

Repowering Poland
Published
12/2022 by Thomas Hartwig
The Polish government is planning a 13-gigawatt market for the expansion of renewable energies by 2027. To this end, over 30 billion euros in tender volumes are to be auctioned in the next 5 years.
The plan is mainly based on the realisation of further projects in the field of solar energy. With a total of 9 GW, half of the projects with a size of up to 1 MW and half with a size of over 1 MW are to be auctioned. In addition, there are onshore projects for a total of 3 GW and 1 GW from biogas and landfill gas.
In total, 30.2 billion euros are to be tendered. Already in the coming year 2023, the planned tender volume amounts to 8.7 billion euros. In the following years 2024 to 2027, the projects are expected to amount to 3.5 billion euros (2024), 6.6 billion euros (2025), 5.3 billion euros (2026) and 6.1 billion euros (2027).
Poland will have realised around 12 GW of installed projects in solar energy by the end of 2022. Experts assume that in 2030 the capacities in the solar sector will be expanded to 30 GW.
Onshore wind turbines are installed in Poland with a volume of almost 7,000 MW. The previous record feed-in capacity was reached on 16 February 2022 with 6,718 MW. However, onshore expansion is currently faltering, and the current additions are only due to projects that were started before the introduction of the 10 H distance rule.
The Polish government is focusing more on offshore wind in the Baltic Sea. Currently, two offshore projects with a capacity of 1,440 MW are in the advanced planning stage. They thus represent a significant part of the first phase of the development programme for offshore wind energy in Poland with a capacity of 5,900 MW.
If everything goes according to schedule, the permits for the first two projects should be granted in 2024 and then the first kilowatt hours should be fed into the Polish grid in 2027.